jim_buchanan
Established
This discussion should have its own thread.
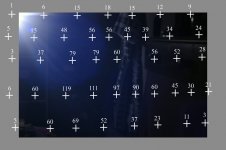
Then, I wondered what would the meter cell sensitivity area look like without any white or grey areas. To do this I covered the shutter with black flocking paper as used in telescopes. The shutter speeds are illustrated in the chart.
Note the "hot spot" on the black chart that corresponds to the meter's position and angle. Remember that the image is reversed and upside down at the focal plane. The black chart is similiar to the R-D1 grey shutter blades chart in that the meter sensitivity is greatest at about 7 o'clock.
If this all is not very logical and a surprise as how the R-D1 meter works, think about this.
The grey and white shutter curtain is the size of a regular 35mm camera covering an image circle of about 43mm. The R-D1 sensor has an image circle of 28mm. ALL M lenses for this camera will deliver light to the entire area of the R-D1 shutter curtain, but the sensor records only 1/1.53 of that area. So, given the hot spot at 7 o'clock, the R-D1 meter will record an image brightness that would not even be in the file, and an underexposed image is highly likely.


jim_buchanan said:I read one post that described the metering as bottom weighted and did not understand until I found this:
http://www.cameraquest.com/voigtbmeter.htm
The R-D1 is exactly like the Bessa, good or bad.
My thought is how I liked the Leica way of the round white circle painted on the shutter curtain, and gave a partial spot/center-weighted reading. I wonder how the shape and size of the R-D1 white meter area would effect metering? Would a 10mm white circle in the middle of the shutter curtain give a correct reading of that 10mm image height on sensor?
jim_buchanan said:I find the whole assembly very odd. The horizontal shape of the meter area. The aiming of the meter cell down and to the left.
In fact, I have just mapped the meter sensitivity area within the 28mm frame lines. My light source is a desk lamp from 8 feet away. The brightest reading was set at 1/1000 sec. The frame was divided into 1/3s for reference.
Then, I wondered what would the meter cell sensitivity area look like without any white or grey areas. To do this I covered the shutter with black flocking paper as used in telescopes. The shutter speeds are illustrated in the chart.
Note the "hot spot" on the black chart that corresponds to the meter's position and angle. Remember that the image is reversed and upside down at the focal plane. The black chart is similiar to the R-D1 grey shutter blades chart in that the meter sensitivity is greatest at about 7 o'clock.
If this all is not very logical and a surprise as how the R-D1 meter works, think about this.
The grey and white shutter curtain is the size of a regular 35mm camera covering an image circle of about 43mm. The R-D1 sensor has an image circle of 28mm. ALL M lenses for this camera will deliver light to the entire area of the R-D1 shutter curtain, but the sensor records only 1/1.53 of that area. So, given the hot spot at 7 o'clock, the R-D1 meter will record an image brightness that would not even be in the file, and an underexposed image is highly likely.